East Providence Schools
What the numbers show.
East Providence’s school budget has grown. The important question is where that growth went, what happened to classroom capacity and special education, and whether the city is competing for teachers.
The Central Finding
More school spending did not mean more classroom capacity.
Special Education
Special education did not keep pace.
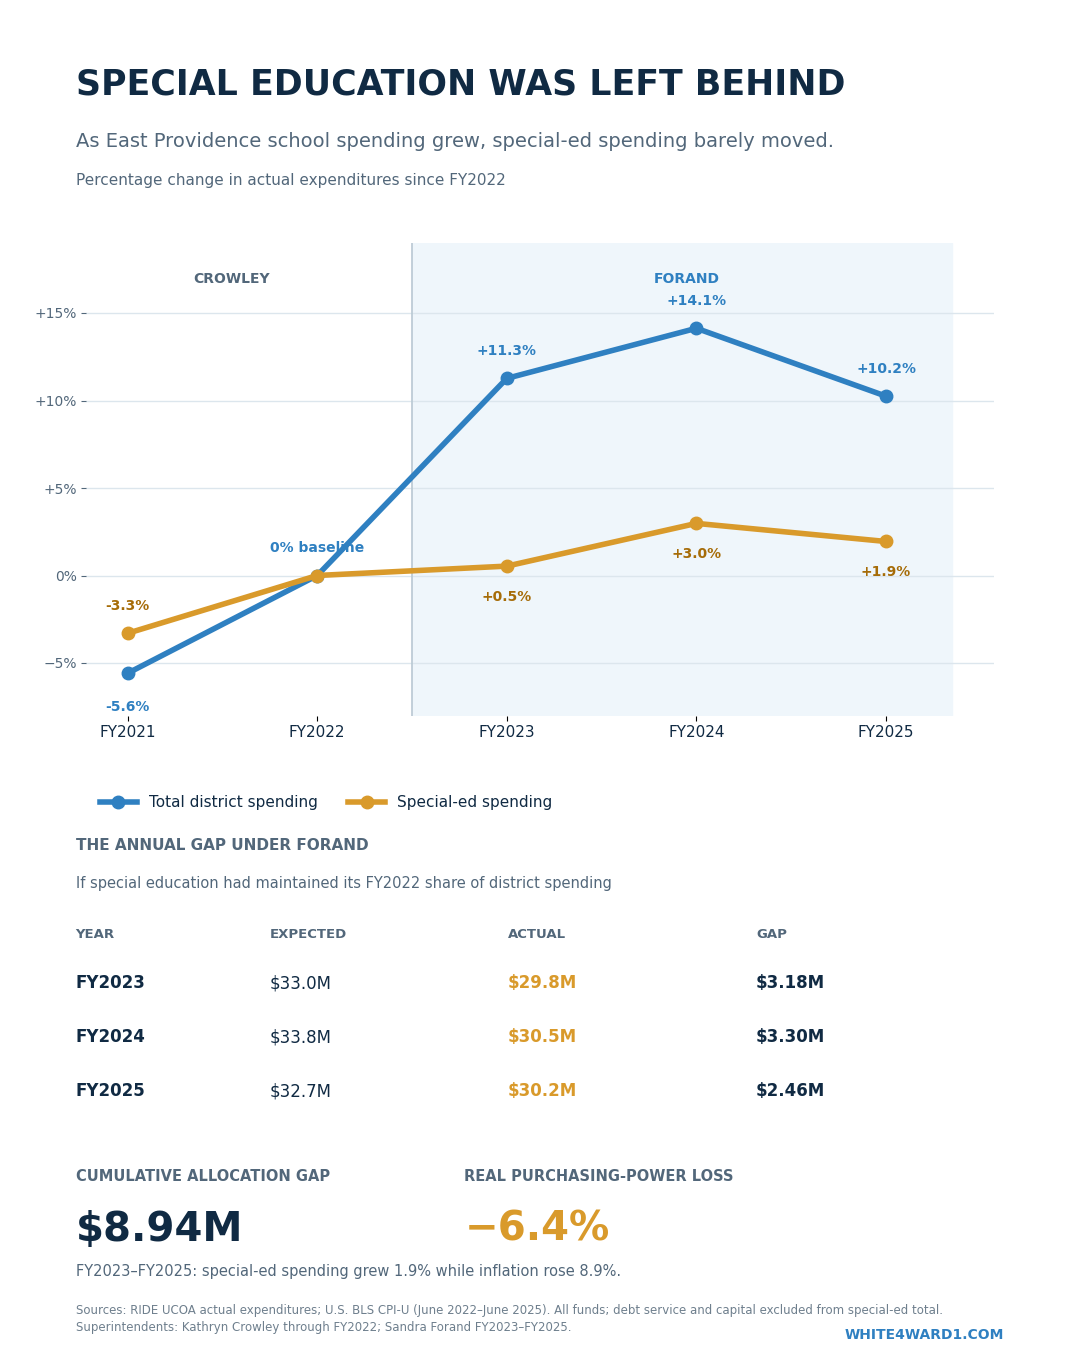
From the FY2022 baseline through FY2025, overall district spending grew much faster than identifiable special-education spending. If special education had maintained its FY2022 share of district spending, the three-year allocation would have been approximately $8.94 million higher.
- Identifiable special-ed spending grew 1.9 percent from FY2022 to FY2025.
- Inflation rose 8.9 percent during the same period.
- That represents a 6.4 percent loss in real purchasing power.
Scope note: “Identifiable special-ed spending” means compensation coded to named special-education job classifications. It is not the complete special-education budget.
 Open full-size graphic
Staffing
The staffing mix changed.
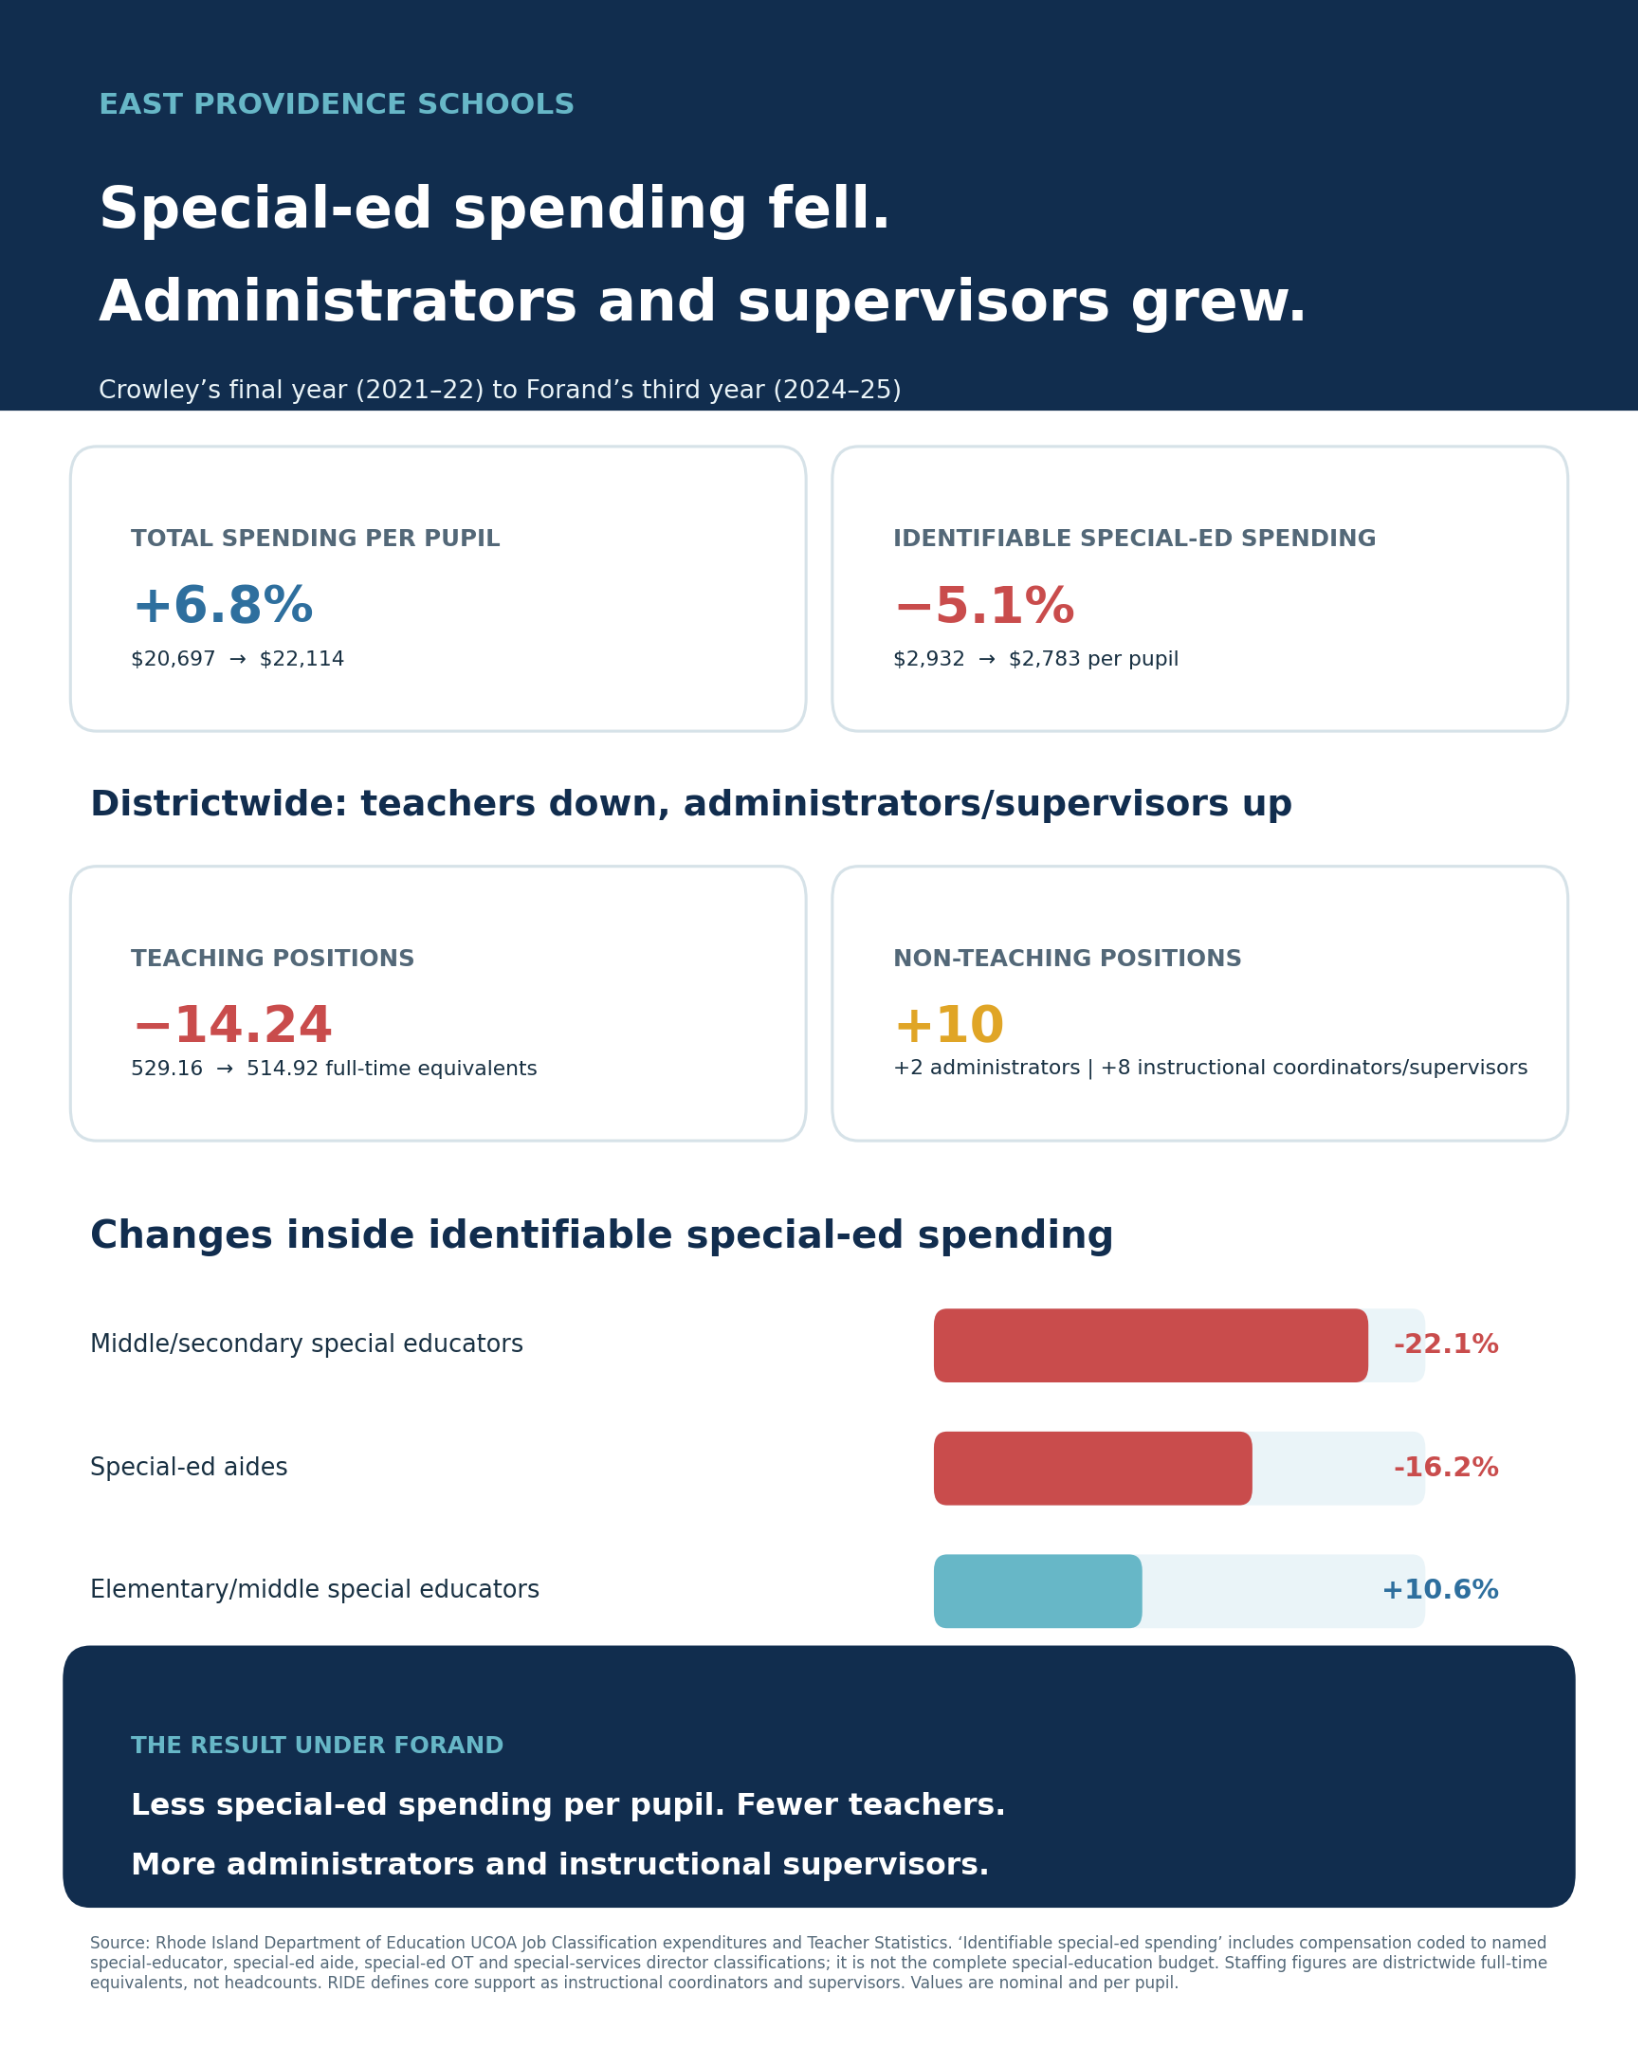
Between Superintendent Kathryn Crowley’s final year and Superintendent Sandra Forand’s third year, districtwide teaching positions declined while administrator and instructional-supervisor positions increased.
- Middle and secondary special educators: down 22.1 percent.
- Special-education aides: down 16.2 percent.
- Elementary and middle special educators: up 10.6 percent.
The point is not that every administrative position is unnecessary. The point is that residents deserve a clear explanation of the tradeoffs and the effect on students.
 Open full-size graphic
Recruitment and Retention
East Providence teachers start behind.
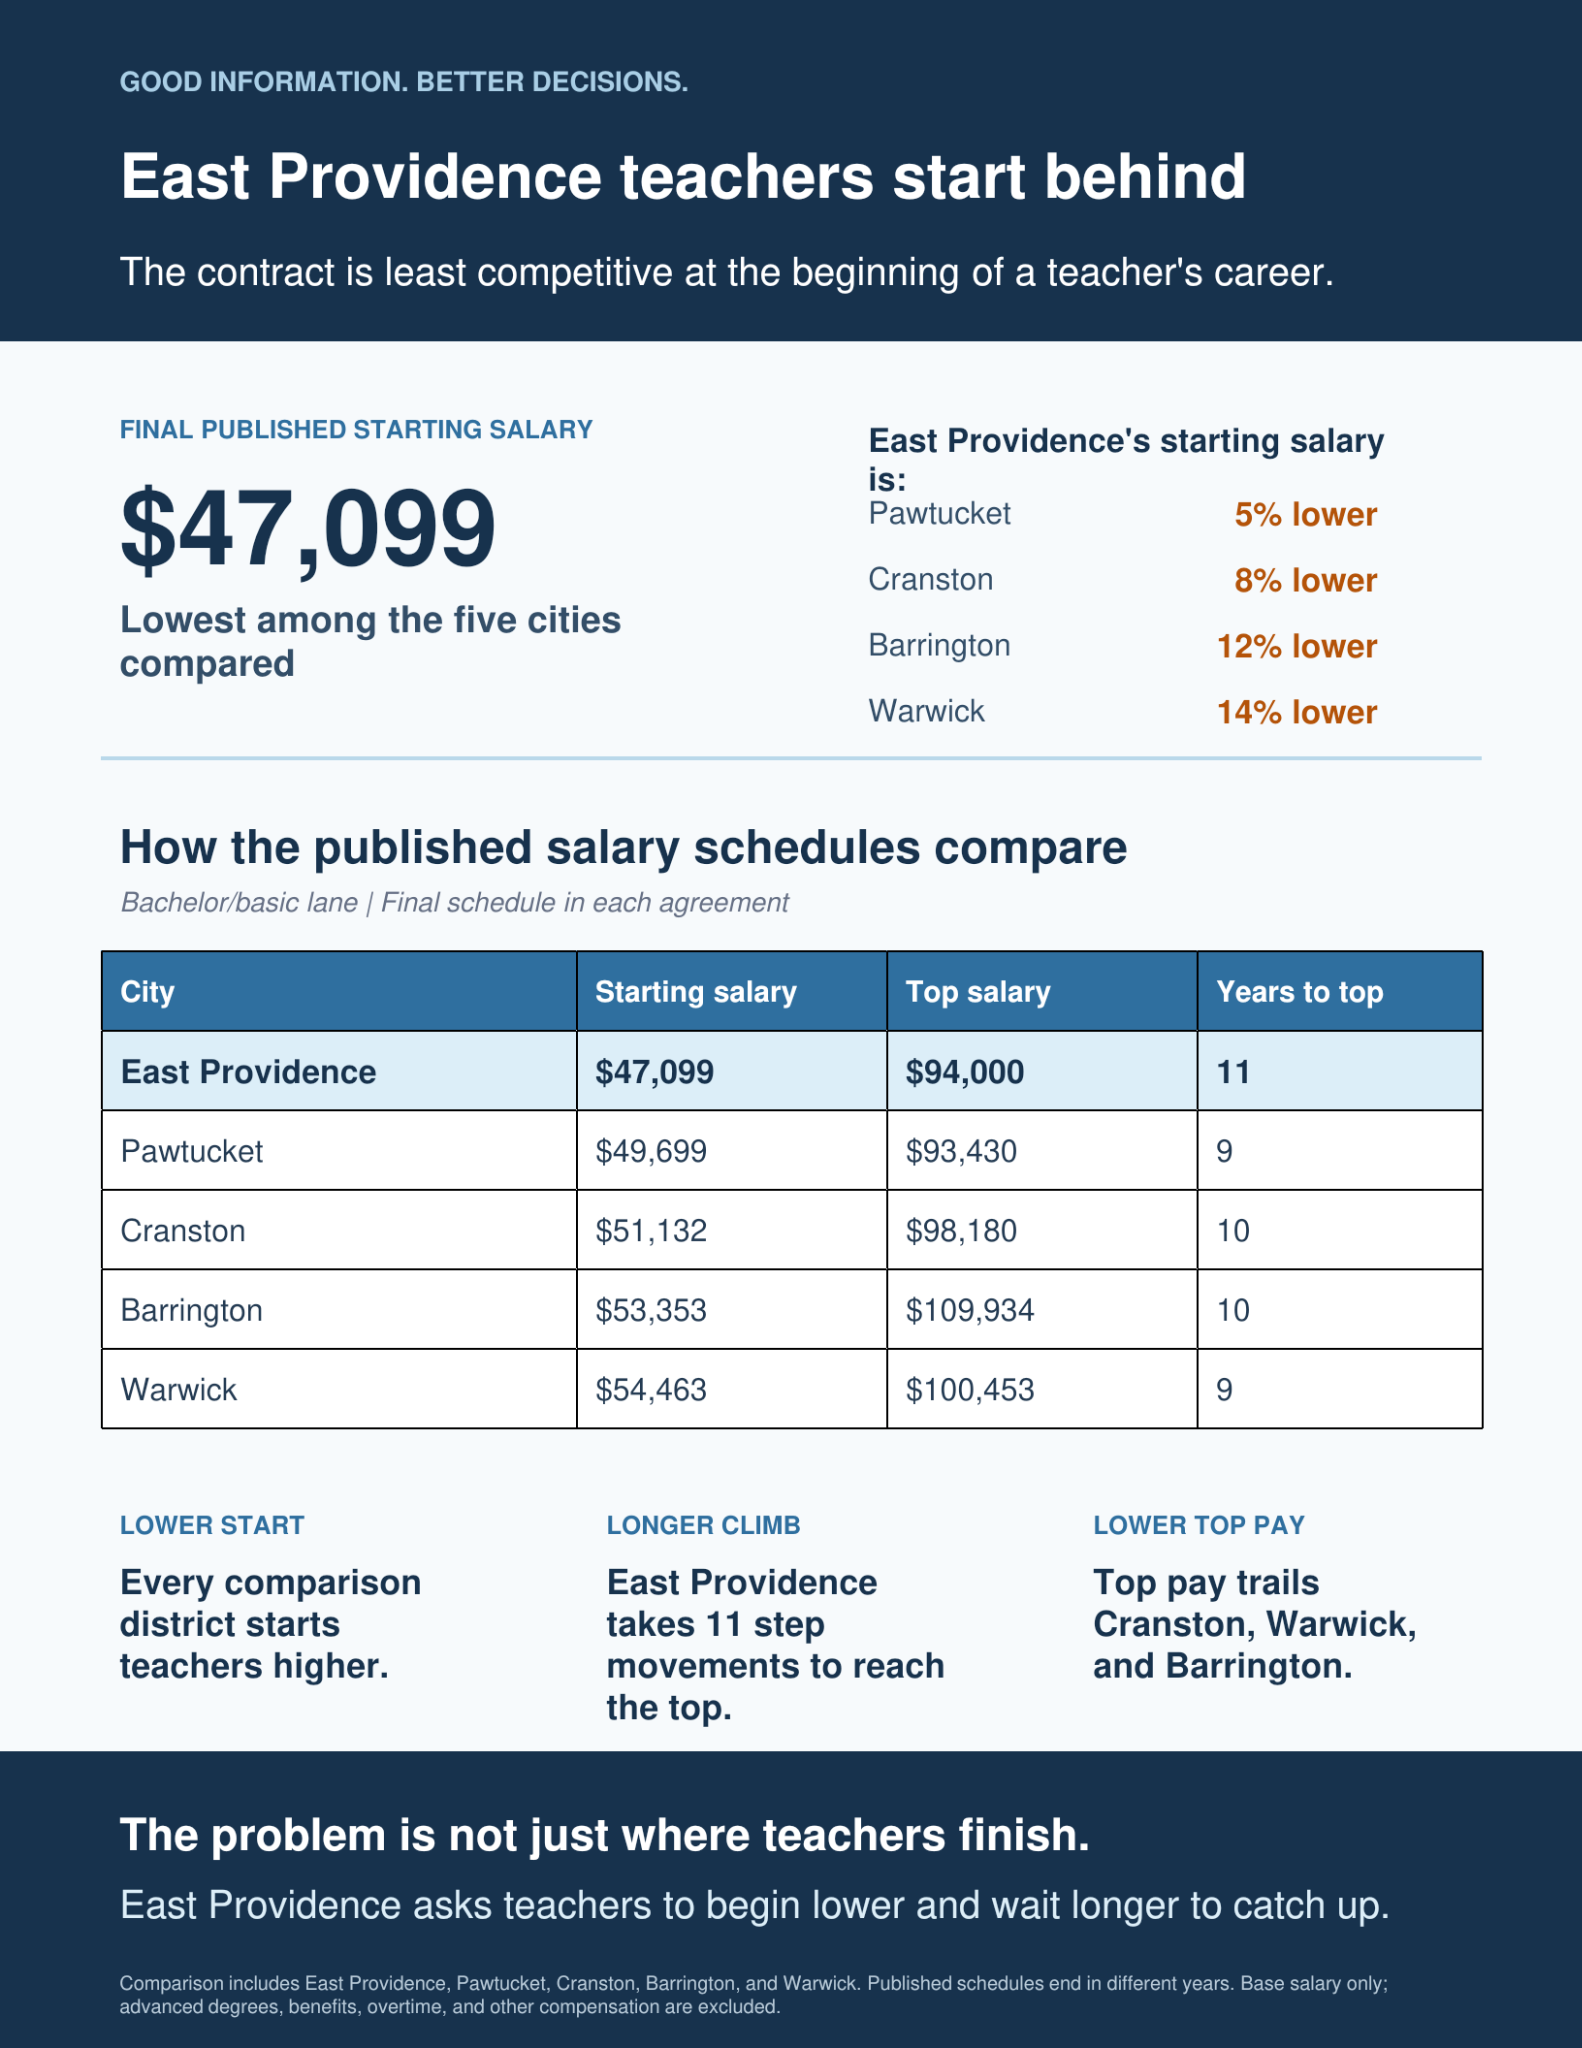
Published salary schedules show the district’s starting teacher pay below Pawtucket, Cranston, Barrington, and Warwick. The climb to top pay is also longer than in the comparison districts.
Teacher pay
East Providence starts teachers at $47,099, the lowest starting salary among the five published schedules reviewed.
Open full-size graphic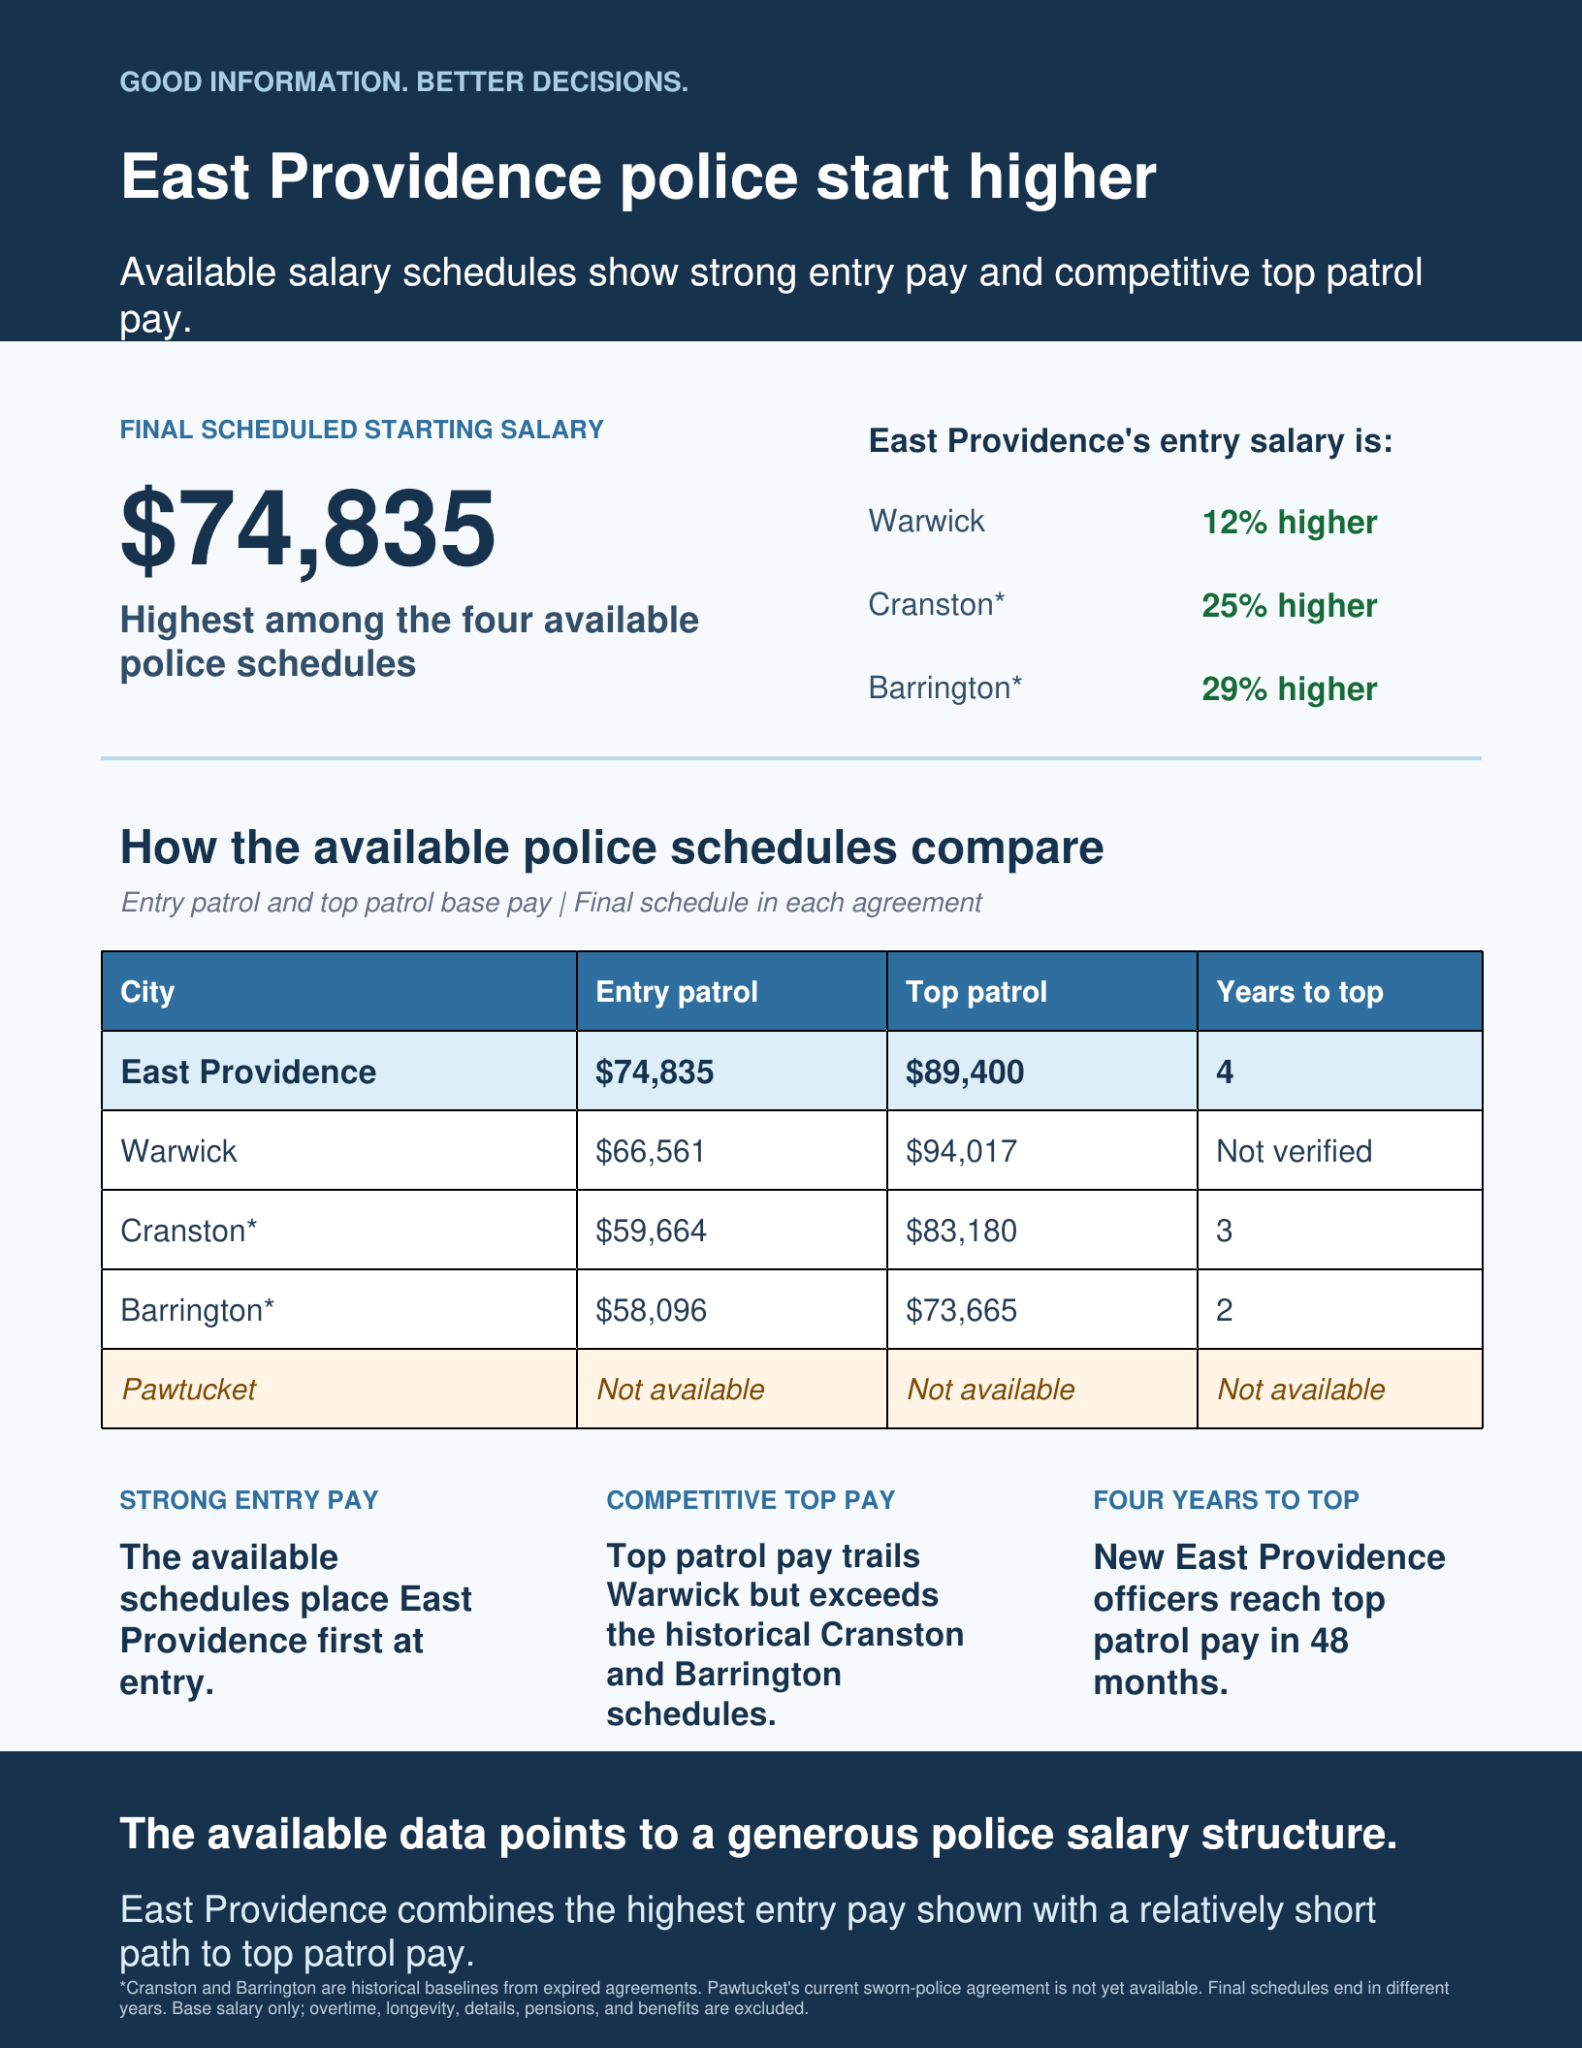
A useful benchmark, not a criticism
East Providence’s competitive police entry pay is evidence that the city knows how to recruit and retain essential public employees. This comparison does not argue that officers are paid too much. It asks why the same urgency is not visible in starting teacher pay.
Open full-size graphicMunicipal Priorities
Follow the money, then ask better questions.
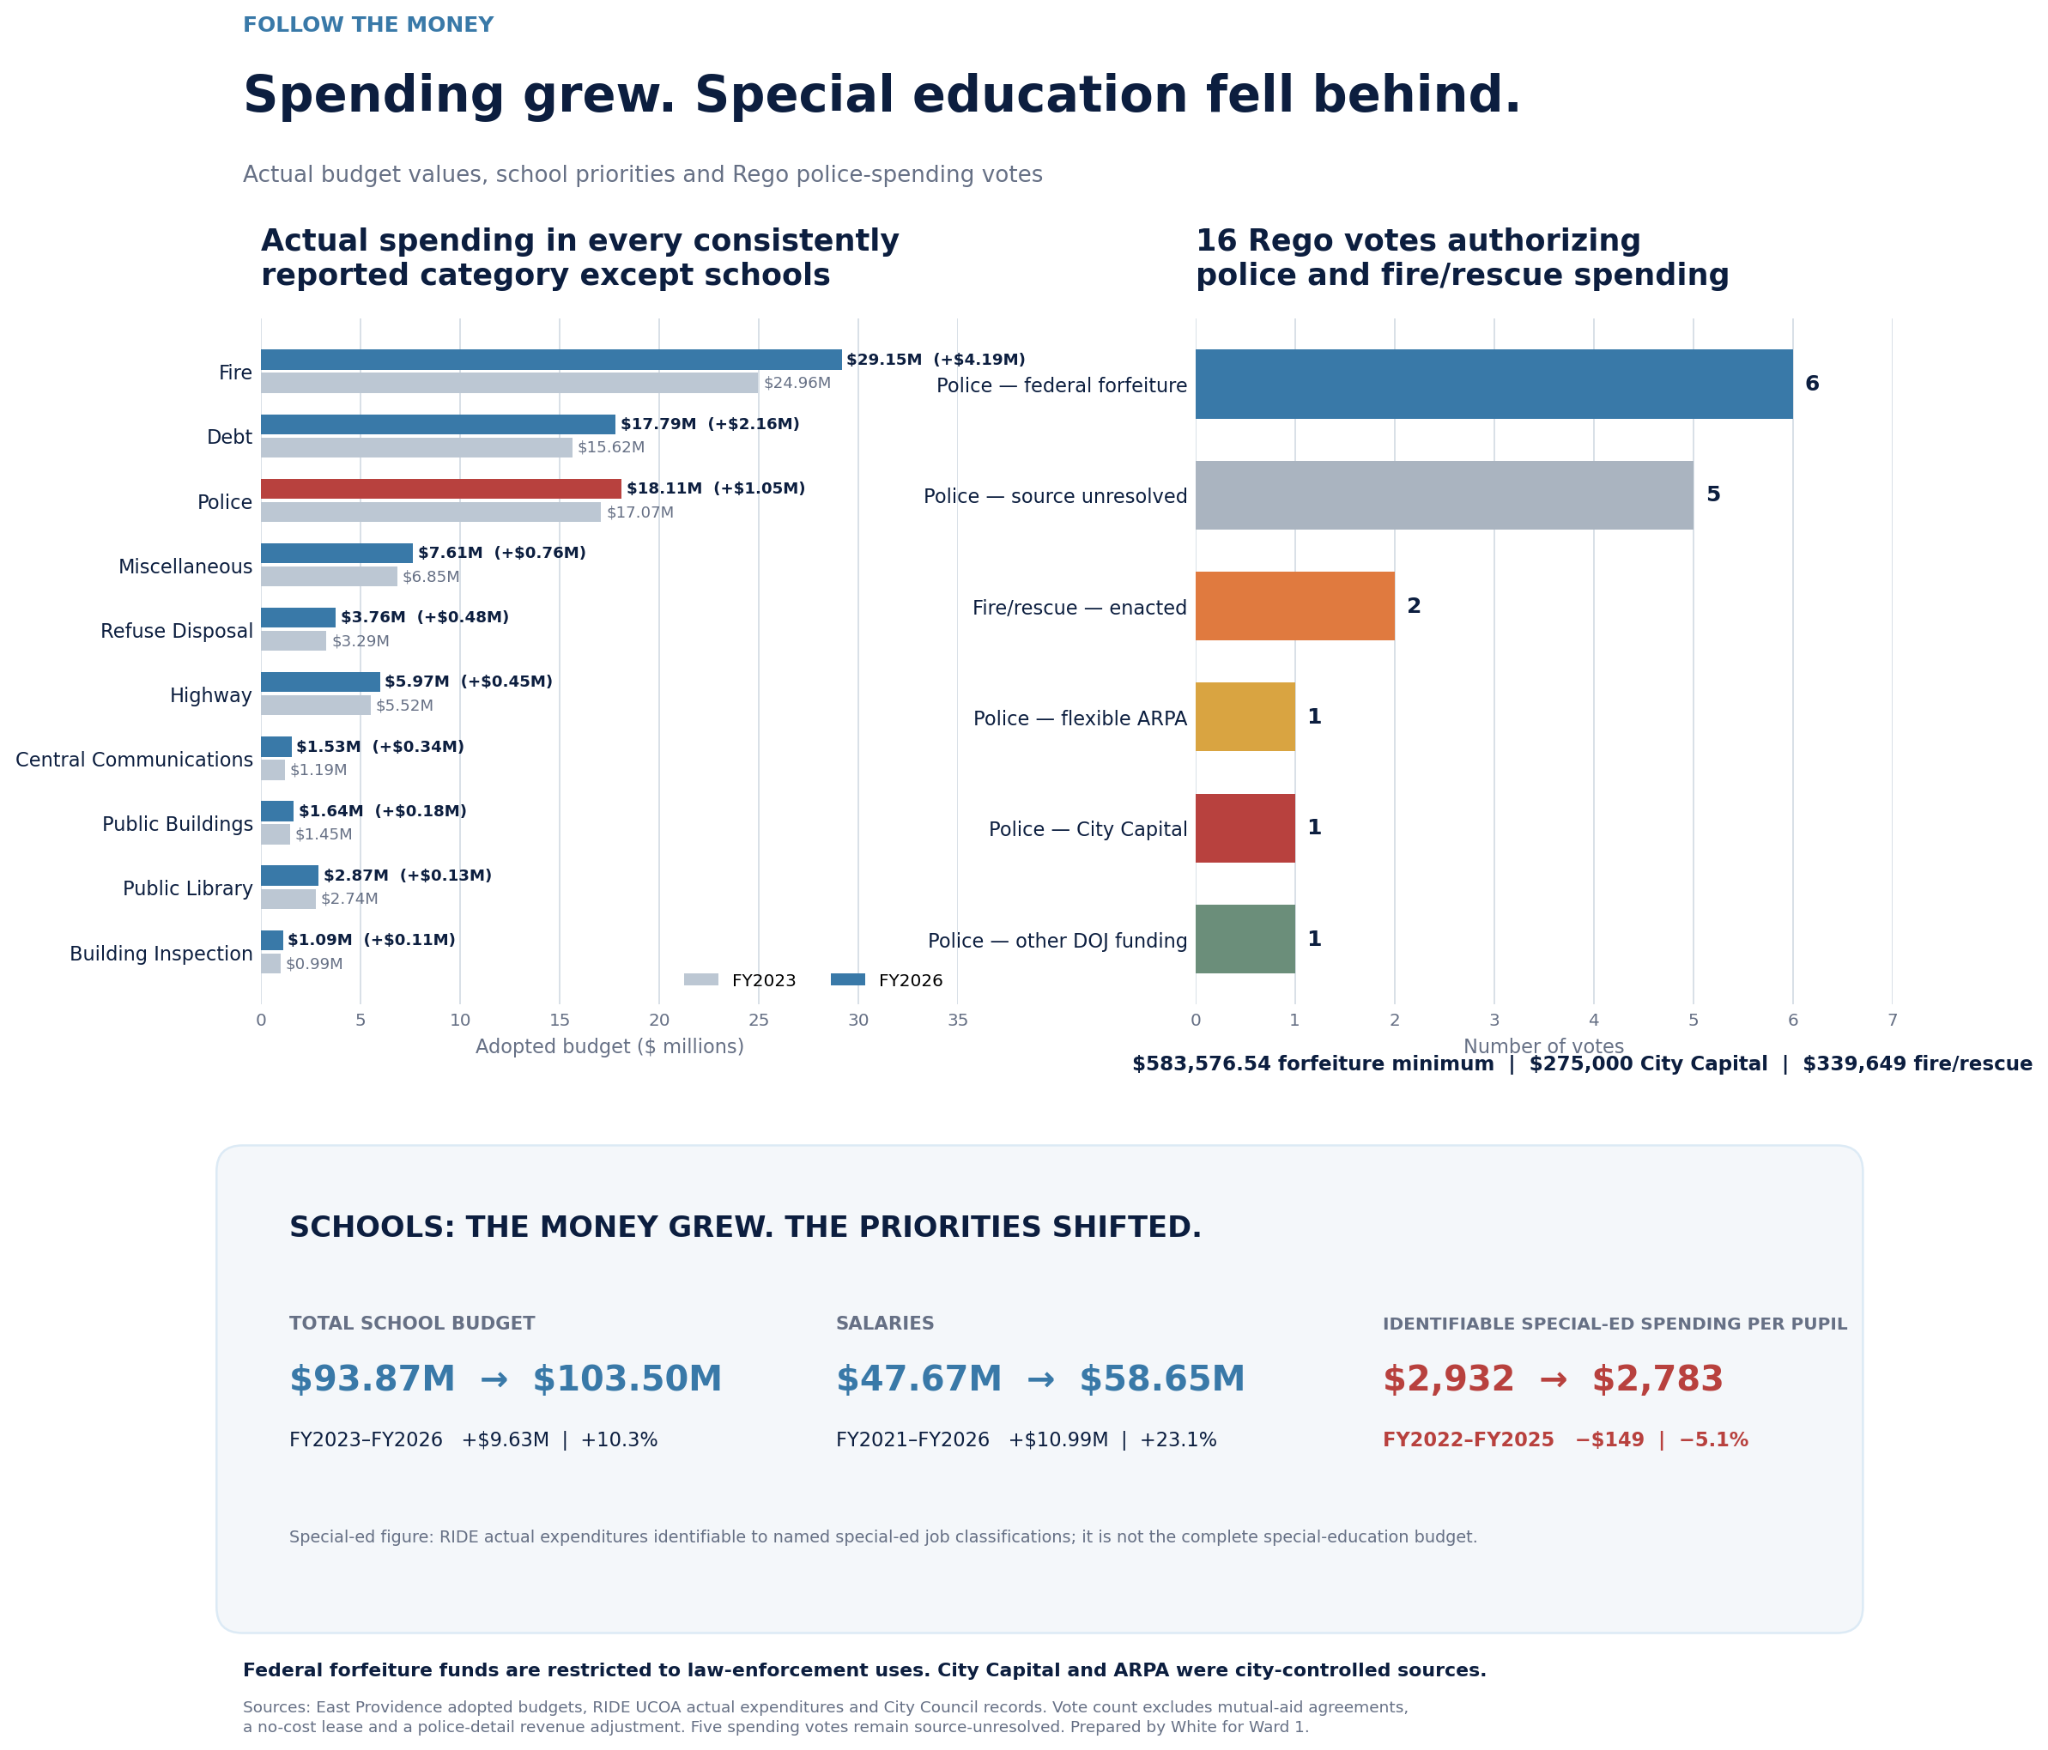
From FY2023 to FY2026, nearly every consistently reported municipal spending category grew while school funding followed a different path. City Council records also show repeated authorizations involving police and fire/rescue funding.
Some sources carry legal restrictions. Federal forfeiture money is limited to law-enforcement uses. City Capital and flexible ARPA funds were city-controlled. Five votes in the review remain source-unresolved. Those distinctions matter, and they are preserved in the analysis.
This is a case for transparent priorities, not for weakening public safety.
 Open full-size graphic
Keep Walking Through the Evidence
See how education came up in the debate.
The viewer guide provides timestamps, context, and supporting links without republishing the debate footage.